


WAR 2.0: Weekly WAR

Those who have followed our blog will remember our big project from last summer, a calculation of each player’s Wins Above Replacement (WAR) from the 2019/20 season. Our original WAR model helped managers to better evaluate players’ contributions to their fantasy team’s overall success, and (hopefully) assisted managers as they drafted their squads for the current season. After much tinkering in the Overthinking Football laboratory, and a few blown deadlines, we are finally ready to share our latest project: an update to our WAR model that will allow us to provide a weekly tally of how many wins above replacement each EPL player has accumulated across the course of an ongoing season for the Fantrax standard scoring draft fantasy game. Without further ado, let’s get into the details.
War Refresher
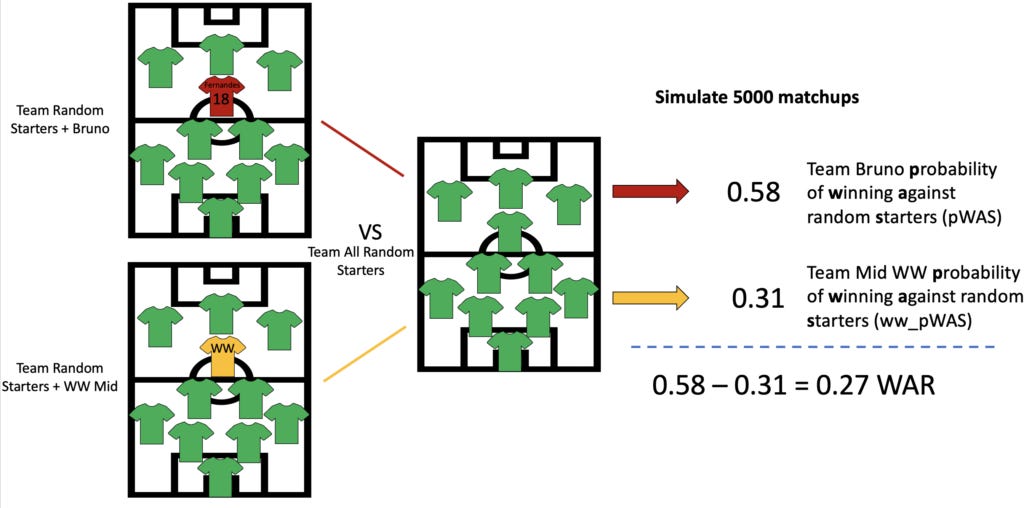
To start, here is a quick refresher on how the current WAR works. WAR stands for “Wins Above Replacement,” and is heavily based off of the baseball WAR concept. In calculating WAR, we first define a set of players that are fantasy starters (players who are definitely owned and are likely contributing to a fantasy team in your league) and waiver wire players (like the name suggests, guys who you could theoretically see on the waiver wire, but might also be sitting on a team’s fantasy bench). After assigning these player designations, we can estimate the probability of a team winning a given matchup when starting Player X compared to if Player X was replaced with a random waiver wire player. By isolating Player X’s contributions and running thousands of simulations, we can calculate just how many fantasy “wins” Player X has earned his fantasy manager compared to an average waiver wire replacement.
What's New?
Weekly War
The primary, and most exciting change to our updated WAR is that all of our calculations now consider scores weekly, rather than averaging player performance across the entire season. This accounts for the fact that a player’s performance in a given game week does not take place in a vacuum. For example, a 20-point performance from a player is considerably more valuable during a blank game week, where fantasy managers may be struggling to field a full roster, than it would be during a double game week, where players have much higher scoring potential. Similarly, if you start Raheem Sterling and he has a hattrick performance, there is a decent chance that City’s other playmakers also put up good scores, potentially diluting Sterling’s impact in your matchup. Therefore, rather than simply calculating the probability of a team winning with Player X in a hypothetical lineup based on a sampling of the player’s season-long scores, we are instead calculating the probability Player X’s team wins in a matchup filled with players starting only from that given game week. Therefore, each of the simulated matchups we run to assess Player X’s win contribution reflect real potential lineups that occurred in the Fantrax universe, giving better estimates of Player X’s value. As a result, just like in baseball WAR, we can keep a running tally of the WAR that a player accumulates over the season to get an estimate of how many more games you have won thanks to Player X being in your lineup than you would have with a waiver wire replacement instead. And yes, this means another set of weekly ranks for your enjoyment!
Actual Fantasy Points versus xFpts
After several Saturday morning debates, we made another major change to our WAR model: transitioning to the use of players’ actual fantasy point totals rather than their calculated xFpts. While we still believe xFpts to be a better evaluative and predictive metric throughout the season, WAR sets out to discover how many wins Player X is actually earning your fantasy team over the course of the campaign. Thus, it made sense to revert to the use of actual fantasy points for our simulated matchups. (For what it’s worth, the switch from xFpts to actual fantasy points did not significantly change our results.)
How does the data look this season?
Limited game week impact
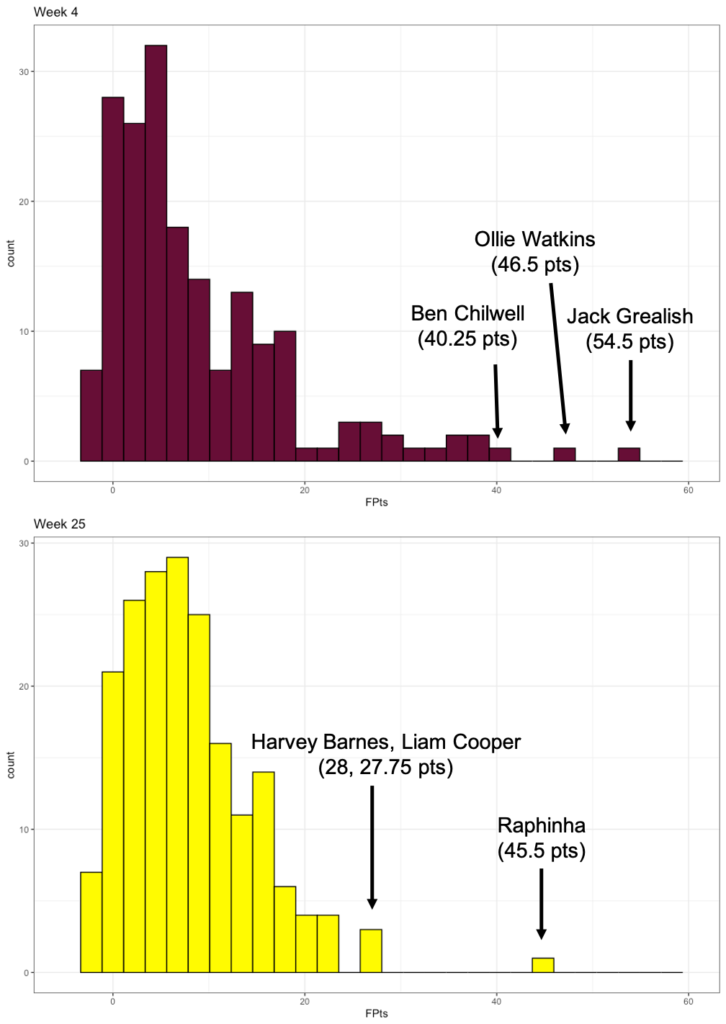
The first observation of note is the narrow range of values in which weekly WAR totals reside. The highest WAR achieved by any player in an individual game week came from Raphinha’s 45.5 point performance in week 25, clocking in at 0.43 total wins earned. On the opposite side of the spectrum, fantasy teams starting Semi Ajayi lost about 0.24 wins following his horrific display of -7.5 fantasy points in week 16. Now those with a keen memory might be thinking: “Hey, Jack Grealish scored 54.5 points in week 4, shouldn’t that have been the highest weekly WAR score!?” Or, “What about Bednarek’s devil’s hattrick (OG, Red Card, PK conceded) in week 22? Surely there could not have been any performance with a worse impact than that!”
While these are very reasonable questions, it also demonstrates the beauty of weekly WAR compared to our previous method. As mentioned above, since player scores do not exist in a vacuum, Bednarek’s terrible score is offset by his defensive teammates who also conceded 9 goals against City. The same rationale applies to Jack Grealish’s 54.5 outburst. His performance was impressive—in fact, it was the highest fantasy score a player has put up all season—but it also happened to be just one of many impressive performances in week 4. Meanwhile, as shown in the histogram below (Fig 2), Raphinha’s 45.5 point performance stood out amongst his game week 25 peers, and thus was more valuable in week 25 than it would have been in week 4.
This phenomenon is demonstrated by the top 10 WAR-producing performances this season (Table 1). While fantasy points is strongly correlated with WAR (Spearman Correlation 0.96), it is not a perfect predictor. Especially at the extremes, where the degree of separation between a player’s points and the rest of the pack is more important than the absolute value, the correlation begins to break down.

Examining the top ten weekly WAR performances above also shows the limited impact a single player can have on his team’s fortunes. With 10 other teammates to offset performances, no individual player can guarantee a victory. However, increasing your chances of winning by 40% (0.4 WAR) for a given game week is an enormous advantage and should not be discounted. Even WAR scores that might seem low can have a tremendous impact. For example, extrapolating 0.13 weekly WAR performances across an entire season would yield 4.94 total WAR—approximately 19/20 KDB levels of fantasy output.
Two above the rest
Two players this season have outperformed their peers, in both fantasy points and WAR. Bruno Fernandes and Jack Grealish have amassed 3.54 and 2.74 WAR, respectively, 0.5 more wins than the next closest player. Given their remarkable output, we got to thinking about how Bruno and Jack compared to our WAR leader from last season, Kevin De Bruyne. Bruno Fernandes is still managing to keep pace, but even Jack’s stellar form cannot keep up with De Bruyne’s massive 19/20 season.
A closer look at boom-or-bust
One of the biggest take-aways from our first stab at toggatrax WAR was the idea that boom-or-bust players generate more wins than consistent mediocre performers. As a result, we advised that managers should prioritize players capable of putting up big numbers over high-floor, low-ceiling consistent performers. This conclusion is perhaps best re-analyzed through the lens of Wilfried Zaha’s 2020/21 season. Most would concede that Zaha has had a somewhat disappointing and inconsistent season (10.00 +/- 11.3 points per start; 181.5 total points), but he has produced a few mammoth scores. Declan Rice, on the other hand, has produced solid performances (7.62 +/- 4.5 points per start; 194 total points) and has maintained a locked position in the West Ham starting lineup, but has not had too many “boom” performances. One might think that Rice’s steadfast production outweighs Zaha’s inconsistent nature, but, as the below gif shows, Zaha’s few massive WAR performances have made him more valuable to fantasy teams this season than the West Ham midfielder.
Once more, WAR favors guys who can score points in bunches, even with inconsistent minutes, over solid, unspectacular players.
Importantly, for boom players with unpredictable minutes (a la Riyad Mahrez), this conclusion holds true as long as a fantasy team has the flexibility to replace these players in matches where the player does not start. As those who have followed us on Twitter know, we are strong proponents of leaving non-starting players on the bench, regardless of who they are.
https://twitter.com/ovrthnkfootball/status/1343939004522233859?s=20
Given this logic, our model assumes that players who are not starting will be benched by their fantasy managers and replaced by a waiver wire replacement for their position. As a result, a non-starting player will always earn 0 WAR. However, if a fantasy team does not have the flexibility to replace a non-starting player in their lineup for one reason or another, they may earn negative WAR for their team that would not be accounted for in our model.
To allow you to follow along as players accumulate WAR across the season, we will be frequently updating WAR ranks alongside our ongoing xFpts rankings. Check out the current WAR Rankings here!
If you have any questions, please feel free to reach out via twitter or email! Also, if you enjoy the gifs and would like to see any specific players, we are happy to make them upon request!
All code and data can be found on our github. xG and xA data pulled from www.fbref.com and fantrax statistics from fantrax.com.