


Quality Starts
We as a Community often boil down player performances to a single number—points per game, points per 90, points per start, etc. Yet while it is convenient to do so, information is often lost in the process. For instance, a player who scores a massive 30 points in his first game but blanks the next 2 will be considered a 10 point/game player. While this is technically correct, this player is very different from a player who actually scores around 10 points every single outing. When trying to make up a large deficit, a manager would prefer the big score potential player, but such a player could prove too much of a headache to consistently trot out each week.
We realize most managers are aware of this discrepancy and have consciously or unconsciously developed their own methods for evaluating consistency. Personally, we often look to standard deviations to try and get a sense of the variability of player scores, but this can also be misleading. As a result, we, like many of you, tend to glance at individual player scores to assess whether most of their points came in a few games, or were the result of reliable, quality performances. While this approach works, it is also quite tedious, especially when trying to assess many players at the same time. Instead of eyeballing how player points are distributed, we have decided to formalize the process to ease the burden of player evaluation.
The basic premise is very simple—categorize player starts into different bins to quickly get a good sense of the distribution of points scored. The three types of "Quality Starts" are as follows:
Q50 Starts - Starts where a player earned xFpts between the 50th and 74th percentile for players of that position group
Q75 Starts - Starts where a player earned xFpts between the 75th and 89th percentile for players of that position group
Q90 Starts - Starts where a player earned xFpts above the 90th percentile for players of that position group
These are very simple metrics involving somewhat arbitrary thresholds, but they nevertheless convey useful information in an obvious and straightforward manner. Managers can quickly assess players' performances for both consistency and "boom" potential.
First, we used data from the 2020/2021 season to find the distribution of player xFpts at each position.
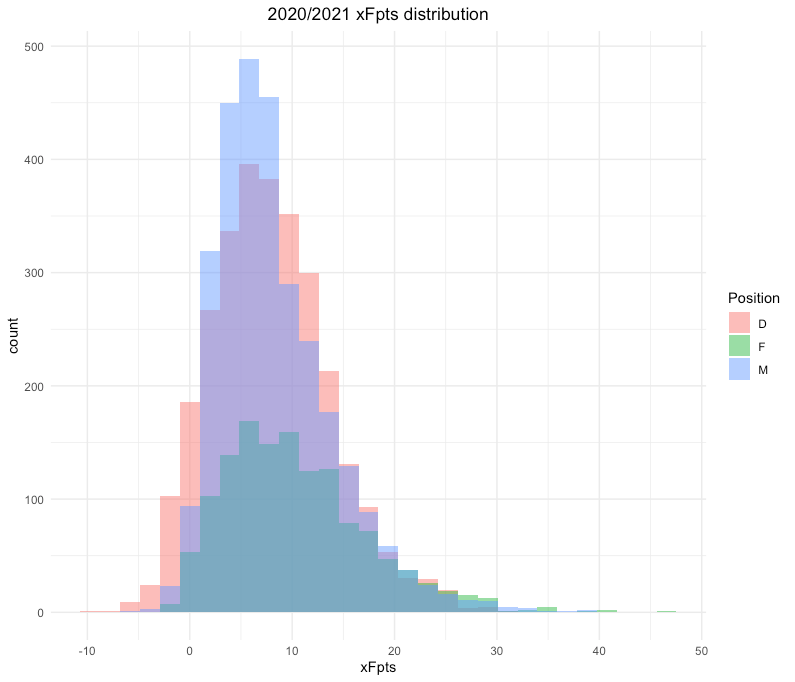
Using these distributions, we calculated the 50th, 75th, and 90th percentiles for each position group (Table 1).
Position50th Percentile xFpts75th Percentile xFpts90th Percentile xFptsDEF7.611.515.5MID7.111.215.9FWD9.414.219.5
We then tabulated the number of Quality Starts (i.e., starts where a player earned xFpts above the 50th percentile for their position group) for each player in the 2020/2021 season. Using the position group xFpts cutoffs listed above, we further identified the number of Q50, Q75, and Q90 starts made by each player.
[table id=8 responsive=scroll/]
In a surprise to no one, Kevin De Bruyne had a perfect record of 100% Quality Starts, the only player to accomplish this impressive feat. Beyond KDB's spotless record, the stratification of player scores into Quality Starts did yield some additional interesting outcomes:
The Community's prototypical "Mr. Consistent," James Ward-Prowse, only achieved Quality Starts in 65.8% of his starts, the 49th best total. On the other hand, Paul Pogba, a player lambasted for his alleged inconsistency, had Quality Starts in 85% of his starts for 6th overall.
Two Burnley stars conventionally known for their reliability, Dwight McNeil and James Tarkowski, produced Quality Starts in only 50% of their starts.
Dan Burn, the towering Brighton defender, produced Q90 starts at a clip higher than community favorite Anwar El
GhaziMessi (31.8% versus 31.3%). Turns out AEG's class is derived less from his humongous upside, and more from his consistent Quality Start output (75% quality starts).
The Quality Start metric, while simple, provides managers with another tool for player evaluation. Save some time sifting through Fantrax player pages, and follow along as we update Quality Start numbers for the current season on our xFpts page.