


A Guide to Overthinking Football
We know, there are a lot of stats out there. Time to explain how we, the Overthinking Football Crew, use our own.


Our initial, and still overarching, goal of Overthinking Football was to expand how the draft fantasy Community uses statistics to make their decisions. It’s always been that simple.
As much as we like to romanticize Draft FPL, it’s a game played on spreadsheets. We know how many points actions are worth, we know how many points each player has earned, and—thanks to Wins Above Replacement—we know how valuable those points were in helping a fantasy team win. So, given that we are playing a game of numbers, we think its important for the Community to have the best understanding of those numbers that they can.
But when we first looked at Fantrax’s statistical offerings a few years ago, we thought they came up woefully short. Points per game (ppg) and points per 90 minutes (pp90), two of the go-to stats of the time, gave fantasy managers an inaccurate understanding of players’ performance. Total fantasy points, a stat still relied upon by some, provides a similarly imprecise view of player value. To fill the statistical blackhole, we created (or adapted) three statistics that can be found throughout our work: expected fantasy points (xFpts), Wins Above Replacement (WAR), and quality starts (QS).
And while we have been thrilled to see these stats used more and more throughout the Community, we can’t help but notice that the best way to use / interpret them is still occasionally confused. As a result, we thought it was time to do something we should have done a long time ago: explain how we use our stats ourselves!
But before we jump in, a quick refresher on our three main stats:
xFpts
xFpts was the first statistic we brought to Fantrax’s Draft FPL game, and still may be the most valuable. While the intricacies of xFpts can be found here, in simple terms, xFpts is a points per start metric that incorporates expected goals (xG), expected assists (xA) and expected clean sheets to gain a better understanding of underlying performance.
Football is incredibly unpredictable. Given the rarity of the most important actions (goals and assists), xG and xA better capture player contributions throughout a match. Most players will not be responsible for the only goal of a match, but if a player has found himself with a plethora of great chances? That’s likely a better marker of future success than a player converting a single, low-quality opportunity. The same applies for defenders: on average, managers are better off chasing future clean sheets through a defender who conceded a goal on a long-range screamer than one who did not concede, but gave up numerous point-blank chances that the opposition failed to convert.

Wins Above Replacement (WAR)
Adapted from the famous baseball metric, Wins Above Replacement is a retroactive statistic that examines just how much value a player contributed to your fantasy team. In calculating WAR, we first define a set of players that are fantasy starters (players who are definitely owned and are likely contributing to a fantasy team in your league) and waiver wire players (like the name suggests, guys who you could theoretically see on the waiver wire, but might also be sitting on a team’s fantasy bench). After assigning these player designations, we can estimate the probability of a team winning a given week’s matchup when starting Player X compared to if Player X was replaced with a random waiver wire player. By isolating Player X’s contributions and running thousands of simulations, we can calculate the added probability of winning Player X provided to his team that week. And by keeping a running tally of the WAR that a player accumulates over the season, we can estimate how many more games you have won thanks to Player X being in your lineup than you would have with a waiver wire replacement.
This method of calculation is particularly helpful because a player’s performance in a given game week does not take place in a vacuum. For example, a 20-point performance from a player is considerably more valuable during a blank game week, where fantasy managers may be struggling to field a full roster, than it would be during a double game week, where players have much higher scoring potential. Similarly, if you start KDB and he has a trio of assists, there is a decent chance that City’s other playmakers (or at least Haaland) also put up good scores, potentially diluting De Bruyne’s impact in your matchup.
Popular statistics such as total points fail to capture these intricacies, and can provide inaccurate portraits of player value. When and how players amass their total points determines how valuable those points were to a fantasy manager, and, at this point, WAR is the best way of measuring that value. Check out a full description of our updated weekly WAR model here.
Quality Starts
Our newest entry into the Draft FPL statistics universe, Quality Starts, again pulls from the baseball world. Whereas xFpts will give you a picture of what a player was expected to score overall, Quality Starts will tell you whether a player had a “quality” performance.
So why are Quality Starts helpful? Let’s take a player who scores a massive 30 points in his first game but blanks the next 2. He will be considered a 10 point/game player. While this is technically correct, this player is very different from a player who actually scores around 10 points every single outing. When trying to make up a large deficit, a manager would prefer the big score potential player, but such a player could prove too much of a headache to consistently trot out each week.
And that’s where Quality Starts come in. Instead of glancing at individual player scores to assess whether most of their points came in a few games or were the result of reliable, quality performances, a manager can use Quality Starts to get a general sense of the percentage of weeks where a player is contributing in a positive fashion.
By breaking down Quality Start data even further—into 50th (Q50), 75th (Q75), and 90th (Q90) percentile starts—we provide an even more detailed look into player score distributions. Managers have access to a quick method of player evaluation, where they can discern the profile and consistency of player output.
How do you use these statistics?
With all of these tools at our disposal, the next question becomes clear: how are we supposed to use all of these? And that’s where this article comes in. For the best answer, I’m going to break this article down into two different parts: draft prep and in-season.

Draft Preparation
When it comes to draft prep, everyone has their preferences. Some like creating elaborate rankings, while others love completing mock draft after mock draft until they lock in a strategy. I’m not here to criticize anyone’s approach—do whatever works for you. But I can give you some insight into where we think our stats (and others available) may be the most helpful.
For us, draft prep is where WAR gets to shine. While WAR is a retroactive stat, it allows managers to evaluate and compare players of different positions and profiles. One of the hardest tasks at draft time is trying to balance positional picks. You must attempt to fill out your midfield and forward line while, perhaps most difficultly, deciding when to pull trigger on a defender. Many people simply turn back to Total Fantasy Points, reasoning that players with higher total points are better. As a result, defenders unsurprisingly drop down the ranks.
With WAR, managers are no longer left with inadequate tools to make these decisions. Since value is relative across position groups—remember, you have to start at least 1 forward, 2 midfielders, and 3 defenders—a defender with the same (or close to same) xFpts as a forward or midfielder may be more valuable to a fantasy team given their production relative to other defenders. Similarly, the forward pool may be shallower in certain years, causing forwards to be more valuable to their team than similarly-scoring midfielders. WAR is the only stat that provides you a window into this phenomenon, and may instruct your decisions about when to pull the trigger on a player that otherwise is further down the total fantasy points chart.
But that’s not all, WAR also helps to distinguish between players of different profiles! The Community sometimes struggles to reconcile that high-upside players who score inconsistently (“boom or bust” players) may be more valuable than their more consistent peers. These scoring inconsistencies may come from their style of play—goal or assist-dependent attackers come to mind—or their starting opportunities (yes, City attackers fit the bill). But what WAR shows us is that score distributions matter, and the best way to create value for your team is by putting up big numbers in a given week. A player like Phil Foden ended up 18th overall in WAR last season with only 22 starts because when he did play, he averaged 14.45 fpts/start, and had 7 outings earning over 20 fpts. You might be tempted to draft a lower-performing every week starter under the guise that getting 8 points every week is better than rostering a player who often finds himself on the bench, but WAR shows us that that decision is not maximizing your roster value.
So, if it wasn’t clear already, we rely on WAR a good bit when it comes to draft prep. It is the best way to evaluate players overall value, and gives us a reasonable idea regarding the type of players that may again be valuable in the coming season. But, a word of warning: WAR is a retroactive stat, and one that is dependent on the individual gameweek scores of the previous season. We like to think it still provides a great window into player value—and provides a better predictor of future performance than something as one-dimensional as total fantasy points—but be aware that a few unlikely, massive performances from a player can have a significant effect on their WAR, especially if those performances came in blank game weeks or otherwise low scoring game weeks. If you don’t think such massive performances are an accurate reflection of a player’s potential, you may want to down-weight their WAR value come draft day. Similarly, players who put up most of their best scores in double game weeks may not get enough credit for their performances, as their efforts could be drowned out by other high scores. For players who have been around awhile, taking a look at their historical WAR from previous seasons can help you navigate the intricacies of WAR and get comfortable with what to expect in the upcoming campaign.
While I just spent four paragraphs lauding WAR’s uses, it’s not the the only thing we rely on in draft preparation. xFpts and Quality Starts are both tremendously useful tools as you try to pick between players and craft the best squad. It should be no surprise that xFpts often function as the first tiebreaker when trying to decide between players. High xFpts, particularly in large sample sizes, are a great predictor of future success and should not be ignored. Players’ xFpts become especially important as you get towards the later rounds, when WAR often dictates that you take risks on upside picks. The higher xFpts a player has, the better chance that they can be a high-WAR player that contributes in a meaningful way to your team, even if their actual fpts/start are lagging behind. And if you anticipate that a player is in for increased playing time? xFpts or average WAR are likely the best tools available for projecting out their future performance.
Quality Starts also can be tremendously useful for those looking to add some consistency to their squad. As you’ll read below, Quality Starts are a great way to differentiate between otherwise similar players, and give good perspective on a player’s score distributions. While the Overthinking Football crew sometimes disagrees about the appropriate balance between “boom or bust” and consistent players, it never hurts to draft players who are providing value to your team week in and week out.
We are proud to present our updated statistics table this season that has all of these metrics in one place! And better yet, the table allows you to create your own visualizations to compare players across different categories, something that we have been taking full use of as we prepare ourselves.

In-Season
Waivers
When it comes to in-season evaluation and waiver wire management, the focus shifts. While a player’s relative season-long contributions are still important to understand, managers may care more about the week-to-week output of their fantasy squad. As a result, WAR may take a bit of a backseat, while xFpts and Quality Starts take the stage.
When I’m logging onto the waiver wire on a Tuesday morning, the first thing I’ll check are the xFpts/start of the available players. If there is a standout xFpts player who, and this is important, has started a reasonable number of matches and is in line for future playing time, then they’re likely at the top of my wish list. If there are a few xFpts leaders? Then I’ll go check their Quality Start numbers to see if a particular player looks more consistent than his peers. I’ll also have a peek at their average WAR to see if I can get a sense about score distribution suggesting one player is more valuable than another.
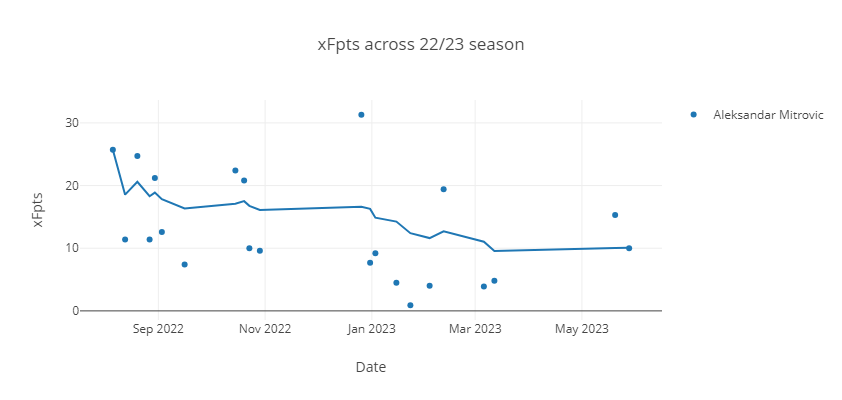
Another benefit of our new stats table is that the visualization engine allows you to see exactly how players are earning xFpts (and every other stat!) in each game. Rather than relying on a single number when picking between similar players, you can use the data chart to see how they fared in each game week. For instance, a player like Aleksander Mitrovic may have had a high xFpts/start throughout the season, but a look at his data chart shows that some great early season performances gave way to some pretty poor form throughout the season. His end-of-the-season 13.1 xFpts/start may not tell the full story about his campaign.
Our stats help you to make more game-dependent decisions as well. If I’m at the end of a gameweek and need a big performance? I’ll check out the top available xFpts getters and then sort to find those with the most Q75 or Q90 Quality Starts. Overall quality start percentage is suddenly less important when you need a one-time big score, and season-long value matters naught. If I’m trailing in my league table and need to take some risks? Perhaps I’ll go after the high xFpts or Q90 player with fewer starts to his name. You can use the stats in tandem with each other to suit your needs, whether its a consistent plug-and-play starter or a high-upside dart throw.
While we may use xFpts and Quality Starts more on a week-to-week basis, WAR is still incredibly valuable during the season. As mentioned above, WAR provides a sense of positional value for a given year. We in the Community often speculate about a given year being “light on forwards” or “heavy on midfielders,” but WAR allows you to confirm those assumptions. Finding players who are outperforming peers due to positional scarcity or an optimal distribution of scores can make the difference at the end of the season.
Trades
There isn’t much more to add in this category, as most of our analysis will run similar to that used for waiver wire management. But one thing we often see online is the idea that managers should simply make trades by adding up the WAR of the various players and comparing them. And we’re here to tell you that isn’t exactly right.
While managers should use WAR as described above—to get a sense of relative positional value, to analyze players’ score distributions, and, in the case of historical WAR, to evaluate a player’s baseline level of value—they should not use it as an end-all, be-all stat when predicting future value. It is important to keep in mind that WAR is a retroactive stat measuring value up to that point in the season. WAR is certainly correlated with future value and should be referenced, but other stats such as xFpts or Quality Stats may provide a better picture of what to expect from a player moving forward.
And that’s it! We’ve been meaning to write an article like this for a long time, and hopefully it proves helpful for those using our work. We know stats aren’t for everyone, but if we have made them slightly more accessible, we’re happy. And for the visual learners among us who really don’t like numbers, take advantage of the data chart! It’s easy, it’s fun, and it gives you a little extra ammo to back up those Twitter arguments!
As always, don’t hesitate to reach out on Twitter (@ovrthnkfootball) or Discord (andrew_overthinking_football or chris_overthinking_football) if you have any questions.
If you use our stats, like what you’ve read, or just want to consume more fantasy content, please consider subscribing! At $5/month or $40/year, you can get access to pre-draft and in-season rankings, stats, articles, projections, and apps, all using the stats described above.
Great read guys, thanks!