


11 Weeks and Barely the Wiser
Ah, we have finally passed 11 game weeks. This far into the 21/22 season, it can be easy to assume that we have seen enough of players to know exactly what kind of asset we are dealing with. While everyone is aware that players are very system - and position - dependent, making player values capable of changing on a dime, at this point at least the true studs should have emerged, right? RIGHT?
Since we sadly do not have a crystal ball to look forward in time, we decided we would do the next best thing: look backward. We were curious to see what the Draft PL climate looked like 11 game weeks into the season last year. By comparing how players performed in the first 11 GWs last season to how they performed throughout the rest of season (ROS), we can get an idea of how predictive the current sample size might be of future performance.
While in general we think total points is a poor metric to use (described in some detail here), in this case it serves as a decent proxy for player production and total involvement. We ranked players by total xFpts and compared how they performed in the first 11 game weeks compared to the ROS.

It immediately becomes quite obvious that player rank is highly variable, even for "elite" players. Only ten players managed to both start and finish the season in the top 25, with 15 players dropping off. Not all drop-offs were subtle either -- James Rodriguez, Riyadh Mahrez, Callum Wilson, Che Adams, and Oliver McBurnie ended the season with ranks lower than 100. Of course some of these changes can be chalked up directly to injury, most notably Pedro Neto, Jack Grealish, and Callum Wilson, but many others do not have this excuse.
We were curious whether player performance was particularly variable in any of the position groups (DEF, MID, and/or FWD) so we performed the same analysis for each group. Because tables are less fun to look at, we instead represent the resulting rank changes in line plots, highlighting players who fell out or rose into the top 25 (or 20, for forwards) on either side of week 11. Players are labeled on the side corresponding to where they fell out of the top tier, with their change in rank shown in parentheses.
First, let's look at the forwards:
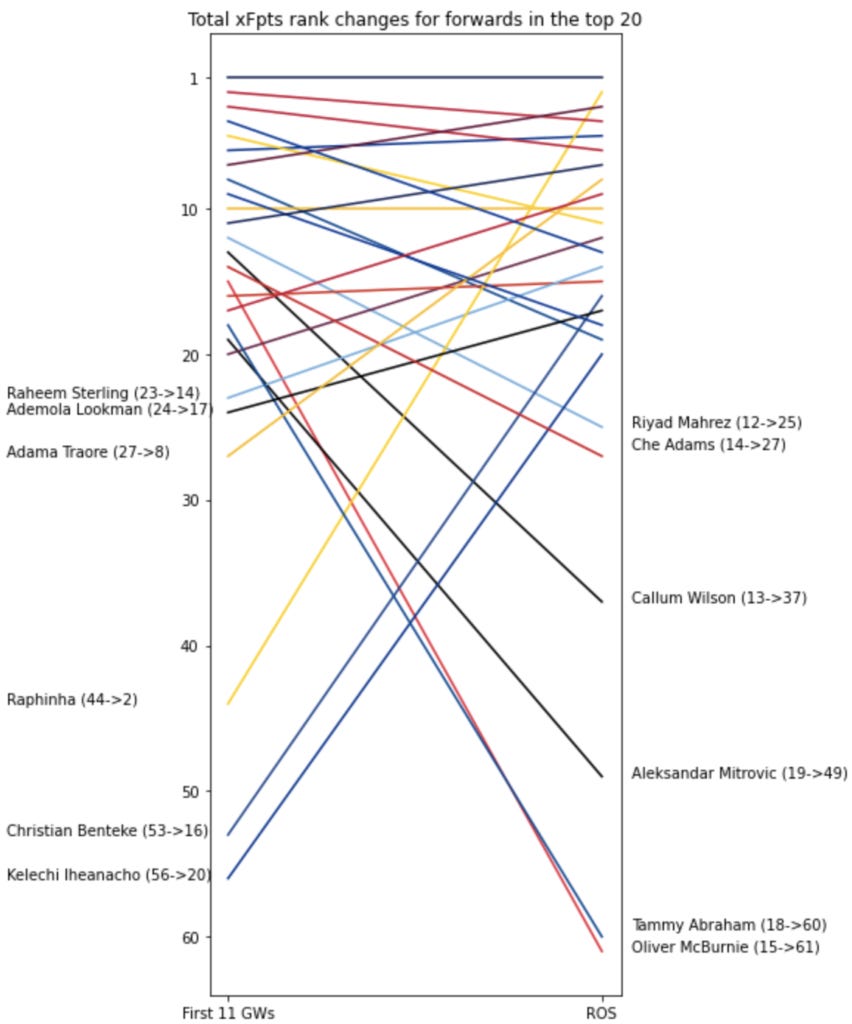
Rather than using the top 25 players in the forward group, I limited the set to only the top 20, as there are far fewer forwards than any other position. Only 6 players moved into, or out of, the top 20, reflecting a general consistency in performance. The biggest risers (and fallers) can largely be chalked up to opportunity rather than a dramatic shift in production or even injury. Players such as Raphinha and Iheanacho seized opportunities when finally given a chance. Raphinha only started 27% of matches in the first 11 game weeks, as compared to 82% across the rest of the season. Likewise, Iheanacho went from 9% starting all the way up to 55% ROS. Neither was merely an injury-replacement either, but rather earned a starting position due to a change in team formation or otherwise beating out the competition. While it's not simple to predict future lineups, there is more signal to identify these types of players than hoping for an injury replacement. While many of us spend too much time on Twitter already, there is considerable value to be found mining team news ahead of other managers!
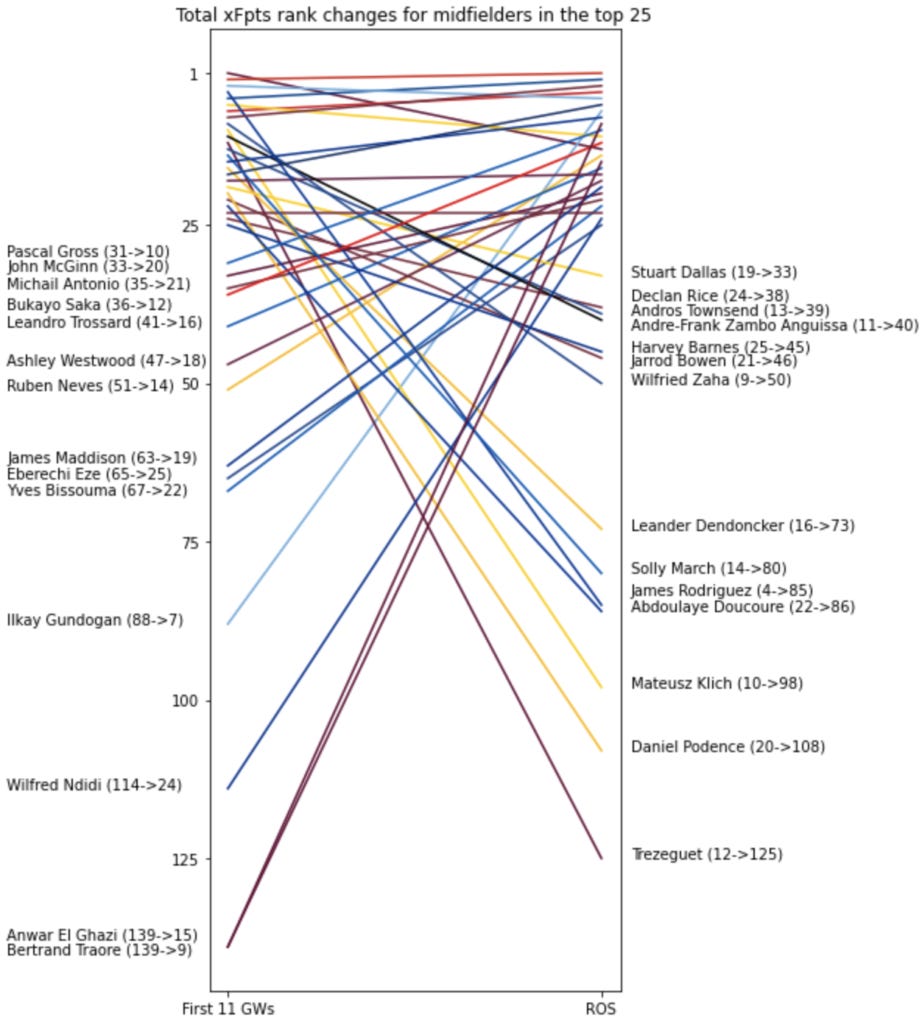
Next, we examined midfielders:
...and defenders:

For both midfielders and defenders, there is considerably more variability in end-of-season ranks. 14 and 15 players shuffled into and out of the top 25, respectively, for midfielders and defenders. Again there are the usual injury suspects such as Tariq Lamptey, Robin Koch, and Solly March, but much more interesting are the players who got off to hot starts and just did not continue their run of Fantrax form, either due to a change in system or simply the end of a hot streak.
One example of unsustainable form in this regard is Darnell Furlong. An early fantasy darling, Furlong would collect 2 out of 3 total assists and 2 of 6 clean sheets in the first 11 weeks, bolstering his numbers enough to garner the 9th overall defender ranking. With his returns so front-loaded, it is no surprise he came crashing back down to earth in the latter half of the season, finishing the year 55th best.
On the flip side, despite a very slow start to the season (63rd through 11 games), James Maddison managed to recoup most of his draft stock vaulting up to 19th overall midfielder over the ROS. After earning a consistent spot in Brendan Rodgers' Leicester lineup, Maddison repaid this trust with a 5G/5A run across game weeks 15-25. Perhaps he warrants a bit more faith from fantasy managers this year?
Obviously the most important aspect of fantasy value is actual availability -- if you never start games, you will not amass points for your team. This is a tricky quantity to predict given differing (often fickle) managerial predilections and the randomness of injuries. We therefore wanted to assess to what degree actual performance was consistent across the two subsets of the season. Did players average similar xFpts per start, or was this also variable?
For each position group, we plotted how each player with at least 5 starts performed:

While there is a reasonable positive correlation (Spearman's correlation = 0.61), contrast this result with the same plot, except splitting the season exactly in half (after 19 games) and using the additional games to trim only for players with at least 10 starts:

Needless to say, the correlation is much stronger, clocking in around 0.74. For those players with at least 8-10 starts we can start to feel reasonably confident about their fantasy value if they continue getting opportunities from the gaffer. For the rest? The future is far murkier. (Note: As the conductors of the xFpts train, we would be remiss if we did not note that these correlations are 0.52 and 0.61 through 11 and 19 game weeks, respectively, when using mean Fpts/start instead. Fpts/start are unsurprisingly way noisier - use xFpts!)
So what does this all mean? Unsurprisingly, sample size is king. The more data we have, the better our ability to make accurate assessments of a player's value on our rosters. Any overly grand conclusions derived from the first 11 game weeks should be taken with a large heaping of salt. Though some trends will certainly stick, others will gradually (or not so gradually!) return to the mean. The best managers have a nose for trends ahead of time, but make sure you are not unduly swayed by a hot streak during a few outings in the early goings of the season or a series of benchings either. When in doubt, trust in your priors!
This brings us finally to this year. How many of the following players do you think will still be in the top 25 by season's end?

All code and data can be found on our github. xG and xA data pulled from www.fbref.com and fantrax statistics from fantrax.com.